How You Have Voted
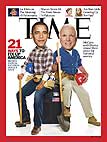
With less than a month to go, John McCain and Barack Obama are jockeying for any advantage with voters. Here's a look at how the American public has voted in past presidential elections, showing margins of victory for individual demographic groups.
You will need to install or upgrade your Flash Player to be able to view this Flash content. Also, Javascript must be turned on.
Source: American National Election Studies, University of Michigan Center for Political Studies
... And Who's Behind The Candidates in 2008
Barack Obama
and Joe Biden
50 percent would choose them if the election were held today.
John McCain
and Sarah Palin
44 percent would choose them if the election were held today.
TIME Graphic by Feilding Cage and Jackson Dykman
This TIME poll was conducted Oct. 3-6 among a national random sample of 1,053 likely U.S. voters by SRBI Public Affairs. The poll includes limited interviews with cell-phone respondents. Likely voters are identified on the basis of their registration status, self-reported likelihood to vote, interest in the campaign and previous voting record, unless a new registrant. Respondents who voted early are included. The margin of error for the entire sample is ±3 percentage points. The margin of error is higher for subgroups. The full questionnaire can be found at www.srbi.com.
This TIME poll was conducted Oct. 3-6 among a national random sample of 1,053 likely U.S. voters by SRBI Public Affairs. The poll includes limited interviews with cell-phone respondents. Likely voters are identified on the basis of their registration status, self-reported likelihood to vote, interest in the campaign and previous voting record, unless a new registrant. Respondents who voted early are included. The margin of error for the entire sample is ±3 percentage points. The margin of error is higher for subgroups. The full questionnaire can be found at www.srbi.com.
