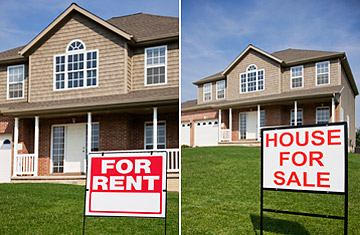
The Homebuyer Tax Credit was a sweet little perk for the housing market, but now it's over. That leaves home prices to rise — or fall — on the merits. Many housing experts believe that with the inventory of unsold homes still high, there could be more price weakness in many markets, so for people thinking about buying a home it may be too early.
But not every market is the same, so it pays to understand well the market you are considering. One of the most respected gauges of housing market value is the Price-to-Rent ratio, calculated by Moody's Economy.com. Essentially, it takes the median purchase price of a home in a market and divides it by the annual rental payments generated on a similar property.
The ratio is not meant to decide whether one particular house is correctly priced. But when the ratio is calculated for a broad metropolitan area, it can impart valuable information. In general, a low P/R ratio indicates home prices in an area are cheap relative to renting while a ratio above 20 indicates renting is the more affordable way to go.
At the end of the first quarter, the average P/R ratio in the country's 54 largest metropolitan markets was 18.8, which was 26% higher than its historic average between 1989 and 2003, notes Alexander Miron, an associate economist at Economy.com. The increase over the historic ratio indicates home prices are higher — relative to rental rates — than historic averages.
The markets with the biggest P/R ratios were Honolulu, San Jose, Seattle, San Francisco, Orange County, Portland, Raleigh and Charlotte, where the ratio averaged between 25 and 36.
The major markets with the lowest P/R ratios were Detroit, Pittsburgh, Phoenix, Cleveland, Orlando, Atlanta and Las Vegas, where the ratio ranged from 12 to 14.
By digging a little deeper into the numbers homebuyers can gain even more insight. Over long periods of time, housing will follow certain valuation patterns similar to the way stocks and bonds do, says Miron. This means that no matter how far out of whack home prices get in any particular cycle, the P/R ratio will usually return to historic averages. The speed of the cycle will depend on such factors as interest rates, unemployment levels, population growth, housing supply levels, household income, foreclosures and rental rates, says Miron.
As a result, it's a good idea to look at historic averages — and how far the current ratio deviates from that level — to get the big picture on how out of whack a market may be at any particular time. In general, P/R ratios that exceed the historic average by more than 20% are markets that are poised to see significant home price declines or rental rate increases or both, says Miron.
The markets posting the biggest deviancies from their historic P/R ratio averages are Baltimore, which is up 73%, New York 66%, Long Island 67%, Seattle 64%, and Charlotte 61%. Others seeing increases of at least 40% from their historic averages are Portland, Raleigh, Honolulu, Milwaukee, Philadelphia, North-Central New Jersey Oklahoma City, Orange County, and Denver.
On the flipside, markets showing smaller P/R ratios than their historic averages — and therefore an environment where buying is more affordable than renting — are California's Inland Empire, Detroit, Chicago, Las Vegas and Sacramento, where P/R ratios are off between 1% and 15%.
"I think the ratio is a great rough and dirty way to compare the markets in terms of cost of ownership versus cost of renting," says Tara-Nicholle Nelson, an attorney, real estate broker, and consumer educator at real estate website Trulia.com. However, she noted there are many other reasons buyers might want to purchase a home even if the ratio isn't at its historic low, such as the tax advantages of owning a home or low interest rates giving them an entry point into a market that is normally out of reach.
The price-to-rent ratio data is not freely available but a major realtor will likely have access to the data for your area.
