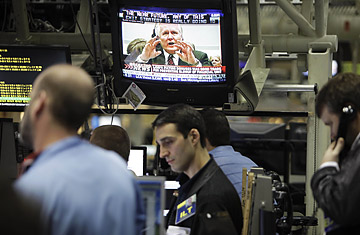
Traders work in the Volatility Index pit at the Chicago Board Options Exchange
The VIX has been making headlines. No, not the rock band or the cold remedy but the Chicago Board Options Exchange (CBOE) Volatility Index, or VIX, which has been on a wild ride over the past year. The stock market crash set this indicator of volatility soaring to above 80 — for perspective, the VIX has historically averaged around 20.
Now it's back down around 40 (see chart below). That's good news. The VIX is interpreted as a measure of volatility in a certain sense, but it more accurately measures fear rather than volatility. That is why the VIX is important to the average investor: it is a sign of uncertainty. So a falling VIX may portend better times ahead. (See pictures of the top 10 scared traders.)
The VIX attempts to predict the volatility of the S&P 500 index over the next 30 trading days using options data from the index's 500 underlying stocks. Specifically, the VIX is a weighted average of the implied volatilities from a large basket of options. That may sound like an indecipherable description, but it basically means that it's a cumulative index of uncertainty. Of course, it only makes full sense if you know a bit about option pricing.
The price of an option, which gives an investor the right to buy or sell a stock at an agreed price, called the strike price, largely depends on the volatility of the underlying stock. If a stock is more volatile, and therefore more likely to move farther up or down, options are more valuable. For instance, as the market has fallen over the past year, investors have flooded into put options — the right to sell a stock — in order to hedge their portfolio against steep falls in the stock market. Thus, the prices of put options increased, and with them, the VIX. (Read "The Volatility Index: A Primer.")
The options market is driving the price of the VIX. But there's a twist: As the stock market falls, investors tend to buy put options in order to hedge against falling prices. As the price of put options increases, the implied volatility of those options increases, and so does the VIX. However, if the S&P 500 had moved in the exact opposite direction this year, the VIX would not have been as high even though the S&P 500's actual, realized volatility would have been identical. Volatility is symmetric to market rises and falls, but the VIX is not. Reason: A falling market scares traders into buying put options, but a rising market doesn't equally scare traders into buying call options.
The VIX is not perfect, nor is the sense of volatility it attempts to predict. Volatility can mean many different things in practice: a stock whose price undergoes large price fluctuations and one that chops quickly in a small range might have the same measured volatility, but they are clearly not equally risky. Even though the concept of volatility is abused and taken for granted in the financial world, it is still the best-known measure of risk and, therefore, useful for investors. (See the best business deals of 2008.)
In fact, the VIX does not even measure volatility. The VIX is a measure of demand for options, more than it is a measure of volatility. More accurately, it takes account of the worst-case volatility that investors writing, or selling, options are expecting. In a relatively stable market, the VIX probably does mimic realized volatility fairly accurately, but in desperate times, as investors flock into put options — and greater volatility is possible in the near future — the VIX is an inflated measure of actual volatility.
Because the VIX is supposed to predict near-term volatility, the VIX calculation only considers options expiring in the next two months. The VIX is measuring "very near-term fear." While many investors look to the VIX as an indicator of a bottom to the market, it does not possess much long-term significance.
What is next for the VIX? That all depends on investors' fear of a further decline in stock prices. Remember: even if the VIX continues to fall, that does not mean that high volatility for stocks is finished. Investors should still hope for volatility, realized from a recovering rally. But a low VIX — signaling reduced uncertainty — would likely signal a coming rally, rather than stagnation in prices.
We're still a long way from the halcyon days of yore — remember, the VIX long term average is half of today's level — but investors at least seem to once again believe that day will follow night. And that's good news.

