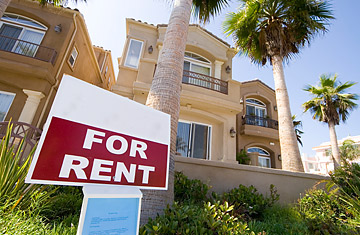
An old trick of the real estate trade is price-rent ratio, sort of the property equivalent of a stock's price-earnings ratio. What it's saying lately is encouraging, though not downright bullish.
Here's how it works: if the price of buying a house divided by the cost of renting an apartment is higher than usual, then houses are more expensive than they should be. A lower-than-normal ratio suggests good value. Changes in these data are of interest not just to potential buyers trying to figure out if it's time to finally jump off the sidelines but also to current homeowners wondering how much more pain they're due for, as well as to policymakers angling to prop up prices. At TIME's request, Moody's Economy.com ran numbers on price-rent ratios for a few dozen markets. "It's one way of estimating how out of kilter house prices are," says Andres Carbacho-Burgos, an economist at the analytics firm.
At first pass, the data suggest we've largely come back to earth. The average price-rent ratio for the 54 metro areas Economy.com broke out was 19.8 for the three months through September, a couple of points higher than the 15-year average of 17.7 but significantly lower than where the ratio stood three years ago, 24.4. By doing some additional math (which we'll explain later), we can surmise that house prices still have to drop 4.6% over the next five years, assuming the price-rent ratio returns to normal over that period. Funny how that almost doesn't seem so bad at this point. And if we look at the entire U.S., which includes many rural areas unaffected by the house-price run-up, the picture is even better — we should be seeing average house-price appreciation of 2.2% over the next half-decade (again, assuming the price-rent ratio reverts to its 15-year average).
Granted, price-rent ratio is hardly the last word in predicting home prices. Economists who use these numbers (including those at Economy.com) take into account a lot of other factors when forecasting, like housing affordability, population trends and how incomes in an area are changing. Price-rent ratio is the quick and dirty way of doing it — but that also makes it more accessible. It's easy to look at a price-rent ratio of 21.7 in Miami, compare it to a 15-year average of 16.8 and realize the market still has quite a bit of room to fall. Just like it's simple to see a price-rent ratio of 13.9 in Indianapolis, line it up against a long-term average of 14.8 for that area and decide it might be time to start house-hunting. If you click here, you can see the breakdown for all 54 metro areas.
To calculate the ratio, Economy.com starts with the median price of a single-family home sold in a particular metro area, using data from the National Association of Realtors. That number then gets divided by what the average apartment would rent for over the course of a year, a number generated by the real-estate-research outfit Property & Portfolio Research. Since each metro area has its own characteristics — there's a lot more land to build on in Oklahoma City than there is in Oakland, Calif., for example — certain pockets of the country have naturally higher price-rent ratios than do others.
Looking at a history of price-rent ratios is one way to tell the story of the housing boom and bust. The average of those 54 metro areas pretty much stayed in the 13-to-15 range from 1983 (when Economy.com's data begins) through 1999. From 2000 to 2001, the ratio started drifting upward, and it really took off in 2002, getting up to almost 25 in late 2005 and early 2006. Since then, the number has fallen, but not yet back to its 15-year average — though that average might be overstating where the ratio will eventually level out, anyway, since it includes the boom years. If the price-ratio needs instead to settle back to its preboom average, then we're easily looking at up to another year of drops based on the current rate of decline, according to Carbacho-Burgos.
How that translates into actual home-price declines is a little tricky. After all, the price-rent ratio is based not just on home prices but on the cost of rentals too. So to figure out what will happen to home prices, you first have to make some assumptions about what will happen in the apartment market. Property & Portfolio Research does such a forecast, which is how Economy.com parlays price-rent ratios into projected house-price appreciation. Those figures tell us that the housing market remains a lumpy place — were price-rent ratios to return to normal, San Antonio would see a 22% drop over five years while San Diego would experience a 28% gain — but, again, price-rent ratio is just one tool for understanding where home prices are headed. Plus, there's that reality, sadly familiar to us all by now, that house prices don't always do what we think they're supposed to.
